Making of the Model
A Unique Opportunity

The BYU model was created during the historic COVID-19 Summer of 2020 when all university activities were canceled and students encouraged to return home for the remainder of the semester. Due to the decreased risk of flying UAVs over people, permission was granted to BYU ROAM to fly and model campus. The Ira A. Fulton College of Engineering and BYU Communications funded the project.
Bryce Berrett lead the project and up to 30 other students, professors, and BYU staff helped in different areas, including data acquisition, pre-processing, processing, post processing, and investigation of use case applications.
Included on this page is a short description of the model making process. A more detailed explanation can be found in our published research article from MDPI Drones.
Model Making Process

Data Acquisition
Photos
UAV/Drone Photo collection included a mixture of automated and manual flights in a dynamic method depicted in the figure below. Manual UAV photos were used to gather data closer to objects of interest and to close the gap between automated flights and ground photos. Most automated flight paths were flown in grid-like patterns with direct overhead and oblique points of view. The Miller Baseball and Softball Park also used BYU ROAM's optimized flight planning algorithm to fly a path based on a former model that reduces images and flight time. This optimized data, along with additional manual flight data, was used in the final model.
Ground photos were taken around buildings to add additional high resolution imagery to drone imagery and to capture detail of areas such as overhangs, building entrances, and walls. To achieve the desired overlap over every structure on campus, 125,527 total photos were taken from ground (terrestrial) and aerial photography.

Surveying
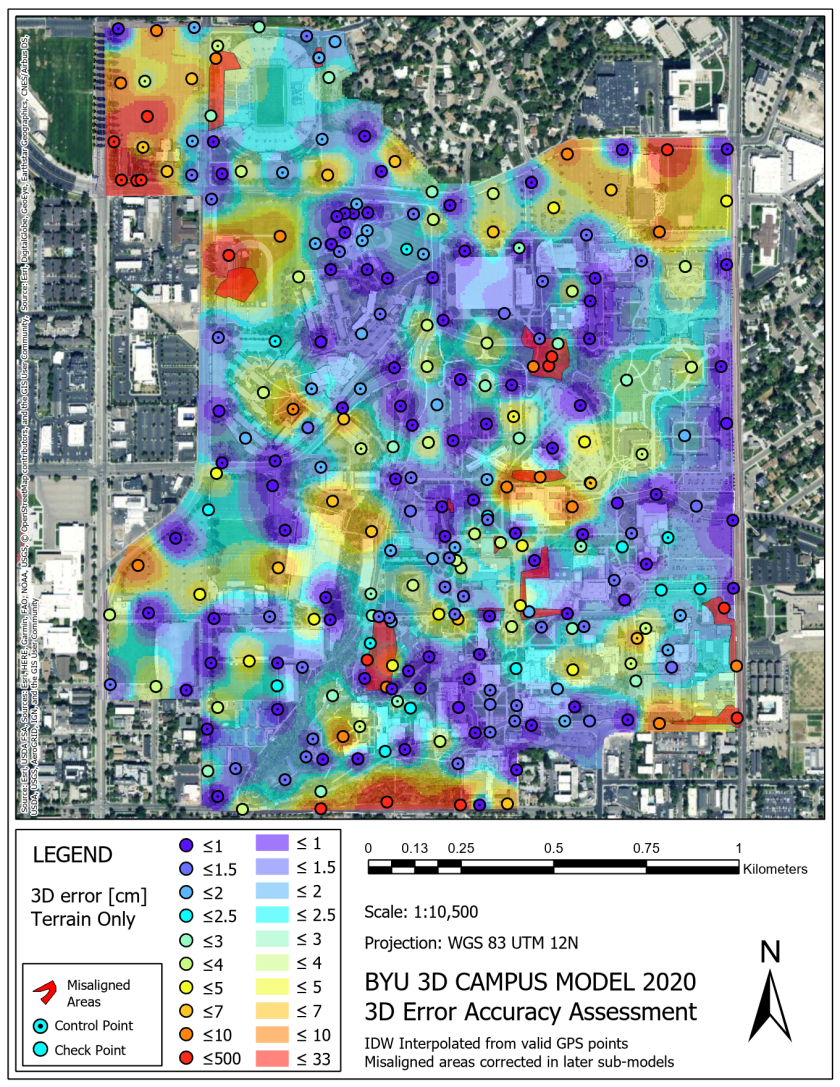
To create a geographically accurate model, 161 survey points were collected using a Topcon GR-3 GPS receiver with hot spot Real Time Kinematics (RTK) correction. These survey points are known as Ground Control Points (GCPs) and were selected based off of visibility from aerial photography. Later, these GCPs were visually tagged in the model and became anchors to geographically align photos in the correct locations within the model.

In addition to GCPs, check points were also needed to verify the accuracy of the model. 118 check points were collected across the 31 different segments of campus. Locations and final accuracies of the model at each Ground Control and Check point are shown in the map below.
Data Processing
After collecting the photos, the data needed to be processed through a photogrammetric technique known as Structure from Motion (SfM). ContextCapture is a SfM software by Bentley and was our software of choice for this project. In simple terms, SfM algorithms look at overlapping photos taken from different positions and connect matching pixel patterns to create a 3D point cloud. It actively adjusts for camera position based on specific camera properties (such as focal length and sensor size). Drone GPS data is not very accurate without RTK corrections but can be used for a first guess of photo positions in the software. GCP data then takes over and makes additional corrections while working with the SfM algorithm in to find the optimal or correct placement of each photo. This not only creates a 3D representation from 2D photos, but also a geographically accurate 3D map.
A more detailed description of Structure from Motion (SfM) can be found on Wikipedia, mathworks.com, or in this article.
Pre-Processing
Before the collected photos were processed, they were edited to improve the program's ability to identify and align pixel patterns and to enhance model aesthetics (how nice the model looks). As shown below, these pre-processing steps involved correcting exposure and temperature, which respectively correlates with evenness of lighting and whether the image tone appears more orange or blue. Photos were also corrected to bring out detail in shadows or bright areas. Blurry, out of focus, and over- or under-exposed images do not often align correctly and were left out of model processing. By the end of pre-processing, 102,818 of the collected photos (82%) were imported into Context Capture.

Processing
Once the images were imported into Context Capture, they began to align into a recognizable model. An example of photo alignment of the BYU Stadium is shown below. The alignment process creates a 3D point cloud (colored points) that will provide the framework for final model. Camera locations are shown in yellow.

After original alignment using only photos was conducted, GCPs were tagged and the model was realigned with respect to the more accurate location data. The geographically aligned point cloud was then used to make a mesh, or series of triangles between points that make up the 3D surfaces of the model. Next, the mesh was textured by overlaying images across mesh surfaces. The result was a 3D reconstruction made entirely of 2D images.
The scope of this model included so much data that it required being divided into 31 different sections for alignment to process properly. All 31 sections were merged together into one whole for mesh and texture creation. Applying the mesh and texture, however, is a time-consuming process that demands an extensive use of computer RAM. Because of this, the model was divided into 2063 separate tiles to be processed individually and placed together upon completion. Therefore, the divide-and-conquer system was key to producing a high-quality model of this scale and was facilitated by using ContextCapture's inbuilt tiling system. This final mesh and texture process took 4-5 computers running in a group, nonstop, for about 3 months.
Post-Processing
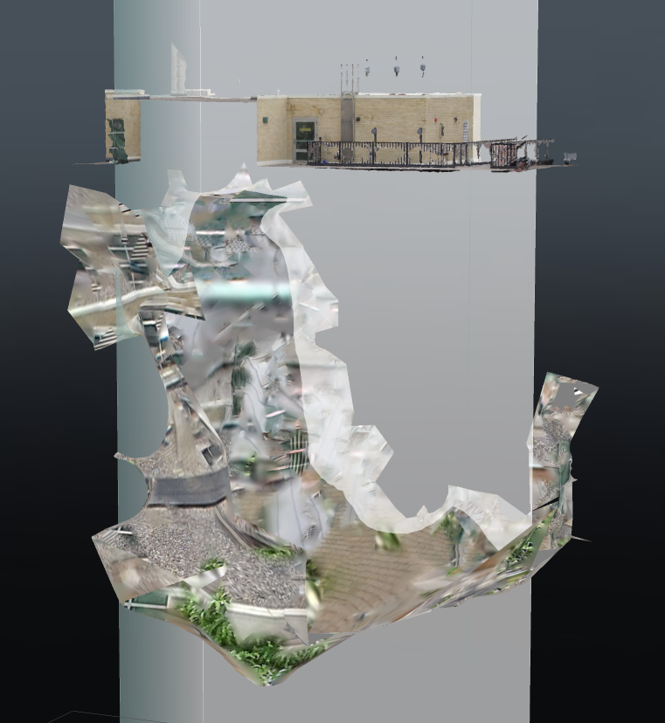
By the time the model was fully rendered, only about 80,384 of the collected photos (64%) made it into the model. In some cases, this was because the software could not find how to align them, possibly due to insufficient overlap with other photos, and in other cases photos were originally misaligned and removed upon inspection. Noise (meaning strange mesh artifacts that do not reflect reality) was common in about half of the model tiles but almost always appeared in the 3D space below the model. All noise was removed manually after the model finished. An example of model noise is shown below.
In addition to noise, there were 10 major model misalignments found after processing that had to be corrected. An example of a misalignment correction appears below at the BYU Stadium. The 23 sections of the model on the Campus Model Directory page show the model post-correction while the full campus model at the bottom of the page currently shows the model pre-correction.

If you would like to learn more, a detailed explanation of the model and model making process can be found in our published research article from MDPI Drones.