Model Facts & Figures
Summary Stats
- 80,384 photos used in reconstruction (from both UAV and Ground Photos)
- 1.65 trillion pixels
- 1.7 square kilometer area
- Over 75 significant structures
- 161 Ground Control Points
- 118 Check Points for accuracy assessment
- < 1cm - 4 cm/pixel dynamic resolution
- < 1 cm/pixel resolution of key structures and statues
- < 0.55 cm Full Model Global (Absolute) Accuracy
- < 4 cm average Global (Absolute) Accuracy
- < 1 cm or 0.16% of actual length average Relative Accuracy
- Model required 4-5 computers running 24/7 for 3 months to process
Model Resolution
Model resolution refers to the actual length that a pixel in the model corresponds to in the real world. The BYU model has an average resolution under 1 cm/pixel but varies dynamically throughout the model. Below is a figure which shows model resolution by location.

Some areas of campus contained model resolution on a pixel per millimeter scale (seen in the Cougar Statue figure below) while other areas such as parking lots and roads were often around a pixel per 4 cms.

Model Accuracy
Global (Absolute) Accuracy
Global or Absolute Accuracy refers to model error based on a world-wide reference system. The BYU model as a whole was under 0.55 cm off of it's actual global position on average. For this project, this is referred to as Full Model error and more stats can be viewed in the table below.

However, because of the scale of the BYU model, not all of the model has the same error. An average model accuracy was calculated that represents the average error when taking a random point from any part of campus. This average error was calculated to be about 3.3 cm.

The map below gives interpolated ground based accuracy data over all of campus for reference. Both control points and check points were used in this case based on the assumption that the control points represent the highest accuracy (as it was used to build the model) and the check points represent areas furthest from control points and the most inaccurate. A weighted average was taken between both kinds of points. When looking at only the Control Points (those sample points taken furthest from the model control points) the average error was about 4.6 cm.

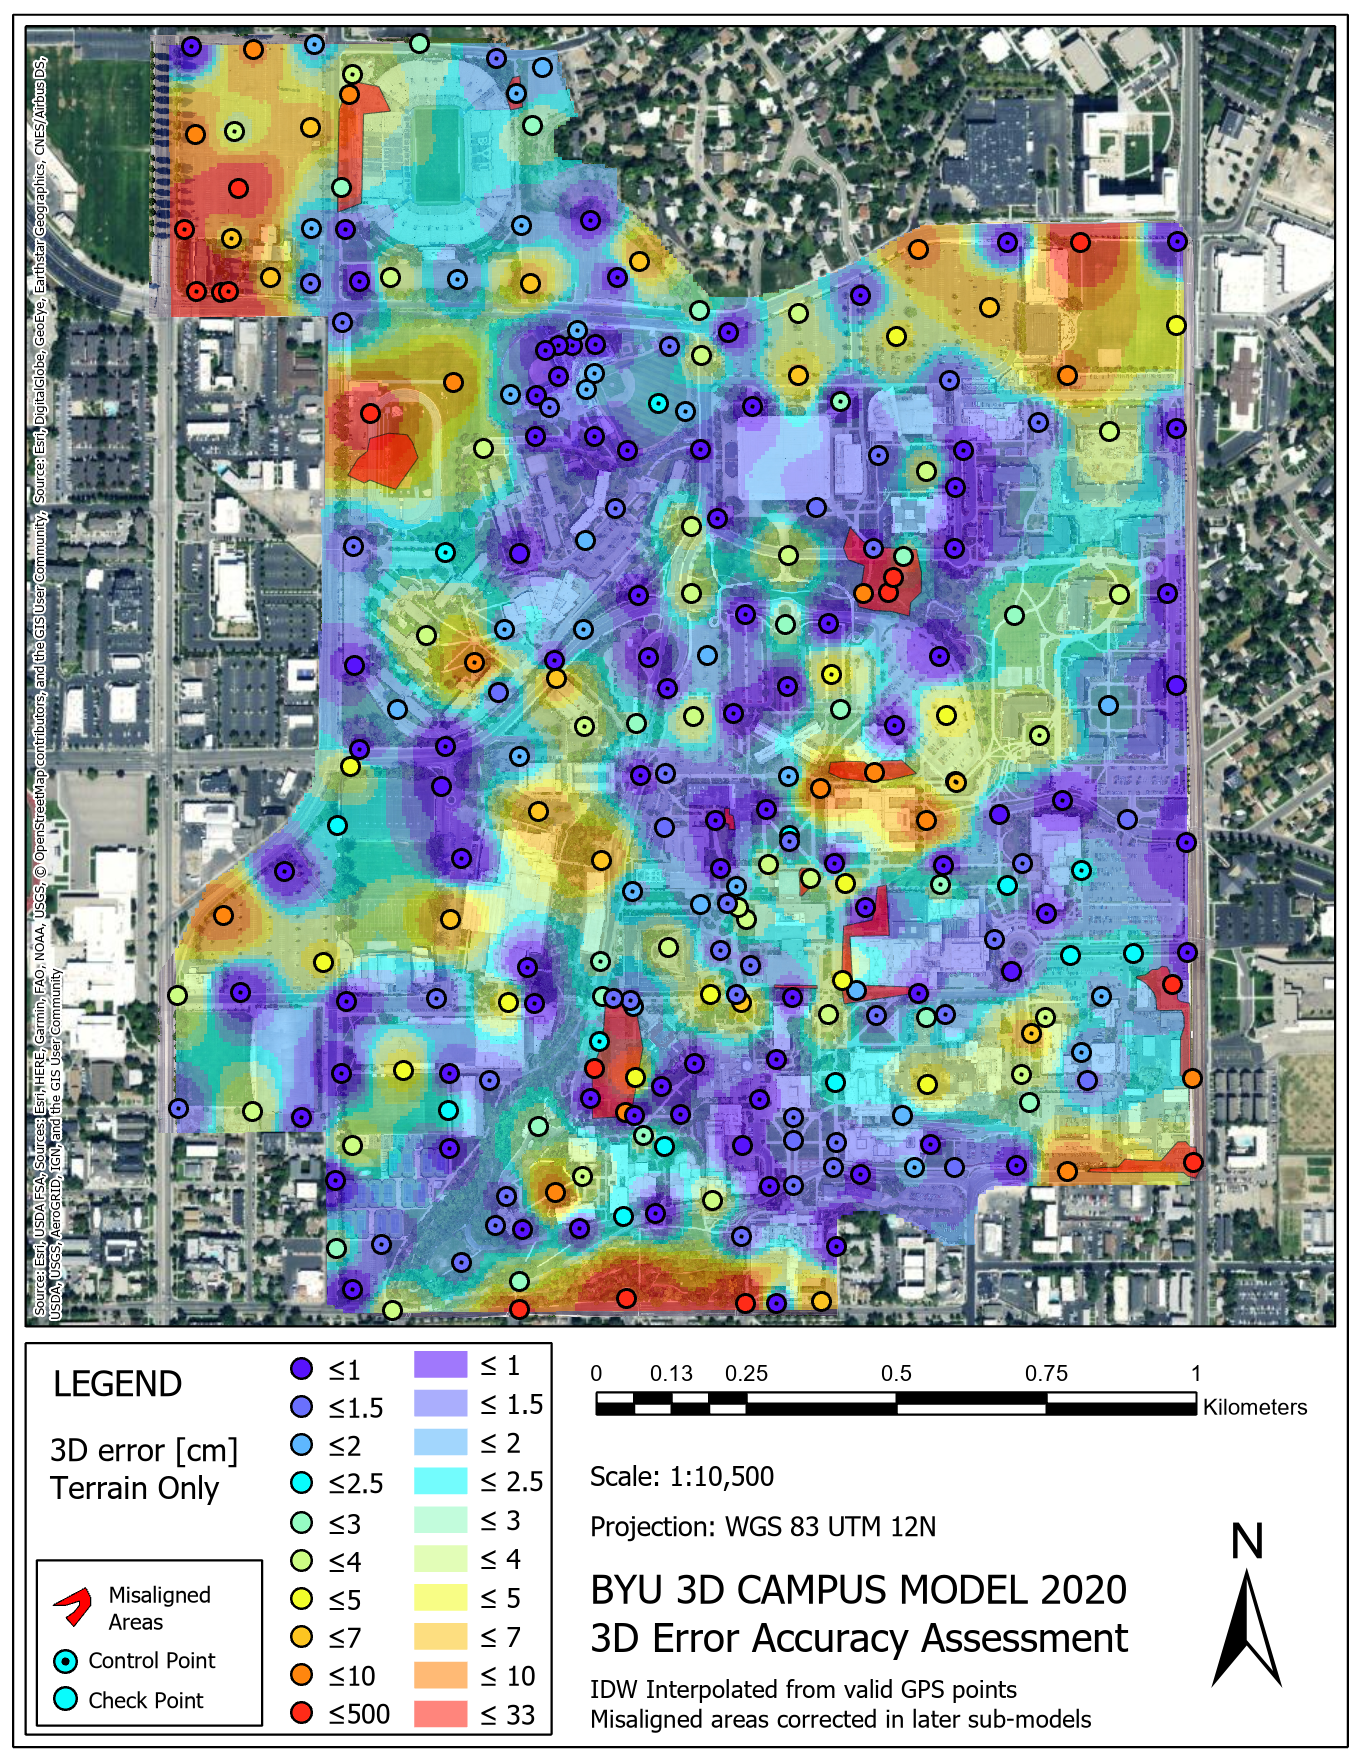
Relative Accuracy
Relative accuracy measurements refer to measurements taken between objects within the model and were taken with a tape measure. Based on over a dozen samples, the average error calculated was 0.64 cm or 0.16% of the actual measurement length. Some of these measurements are shown below. These measurements give an idea of vertical accuracy better than the GPS measurements because all Ground Control and Check Points were taken at ground level.
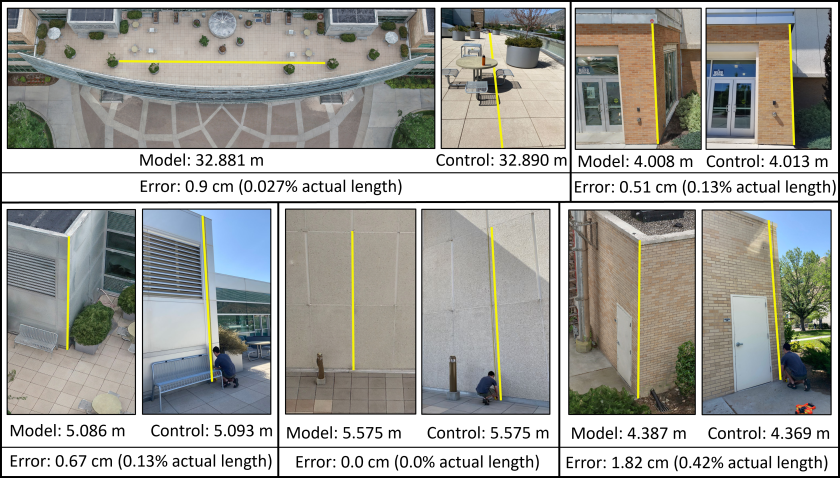
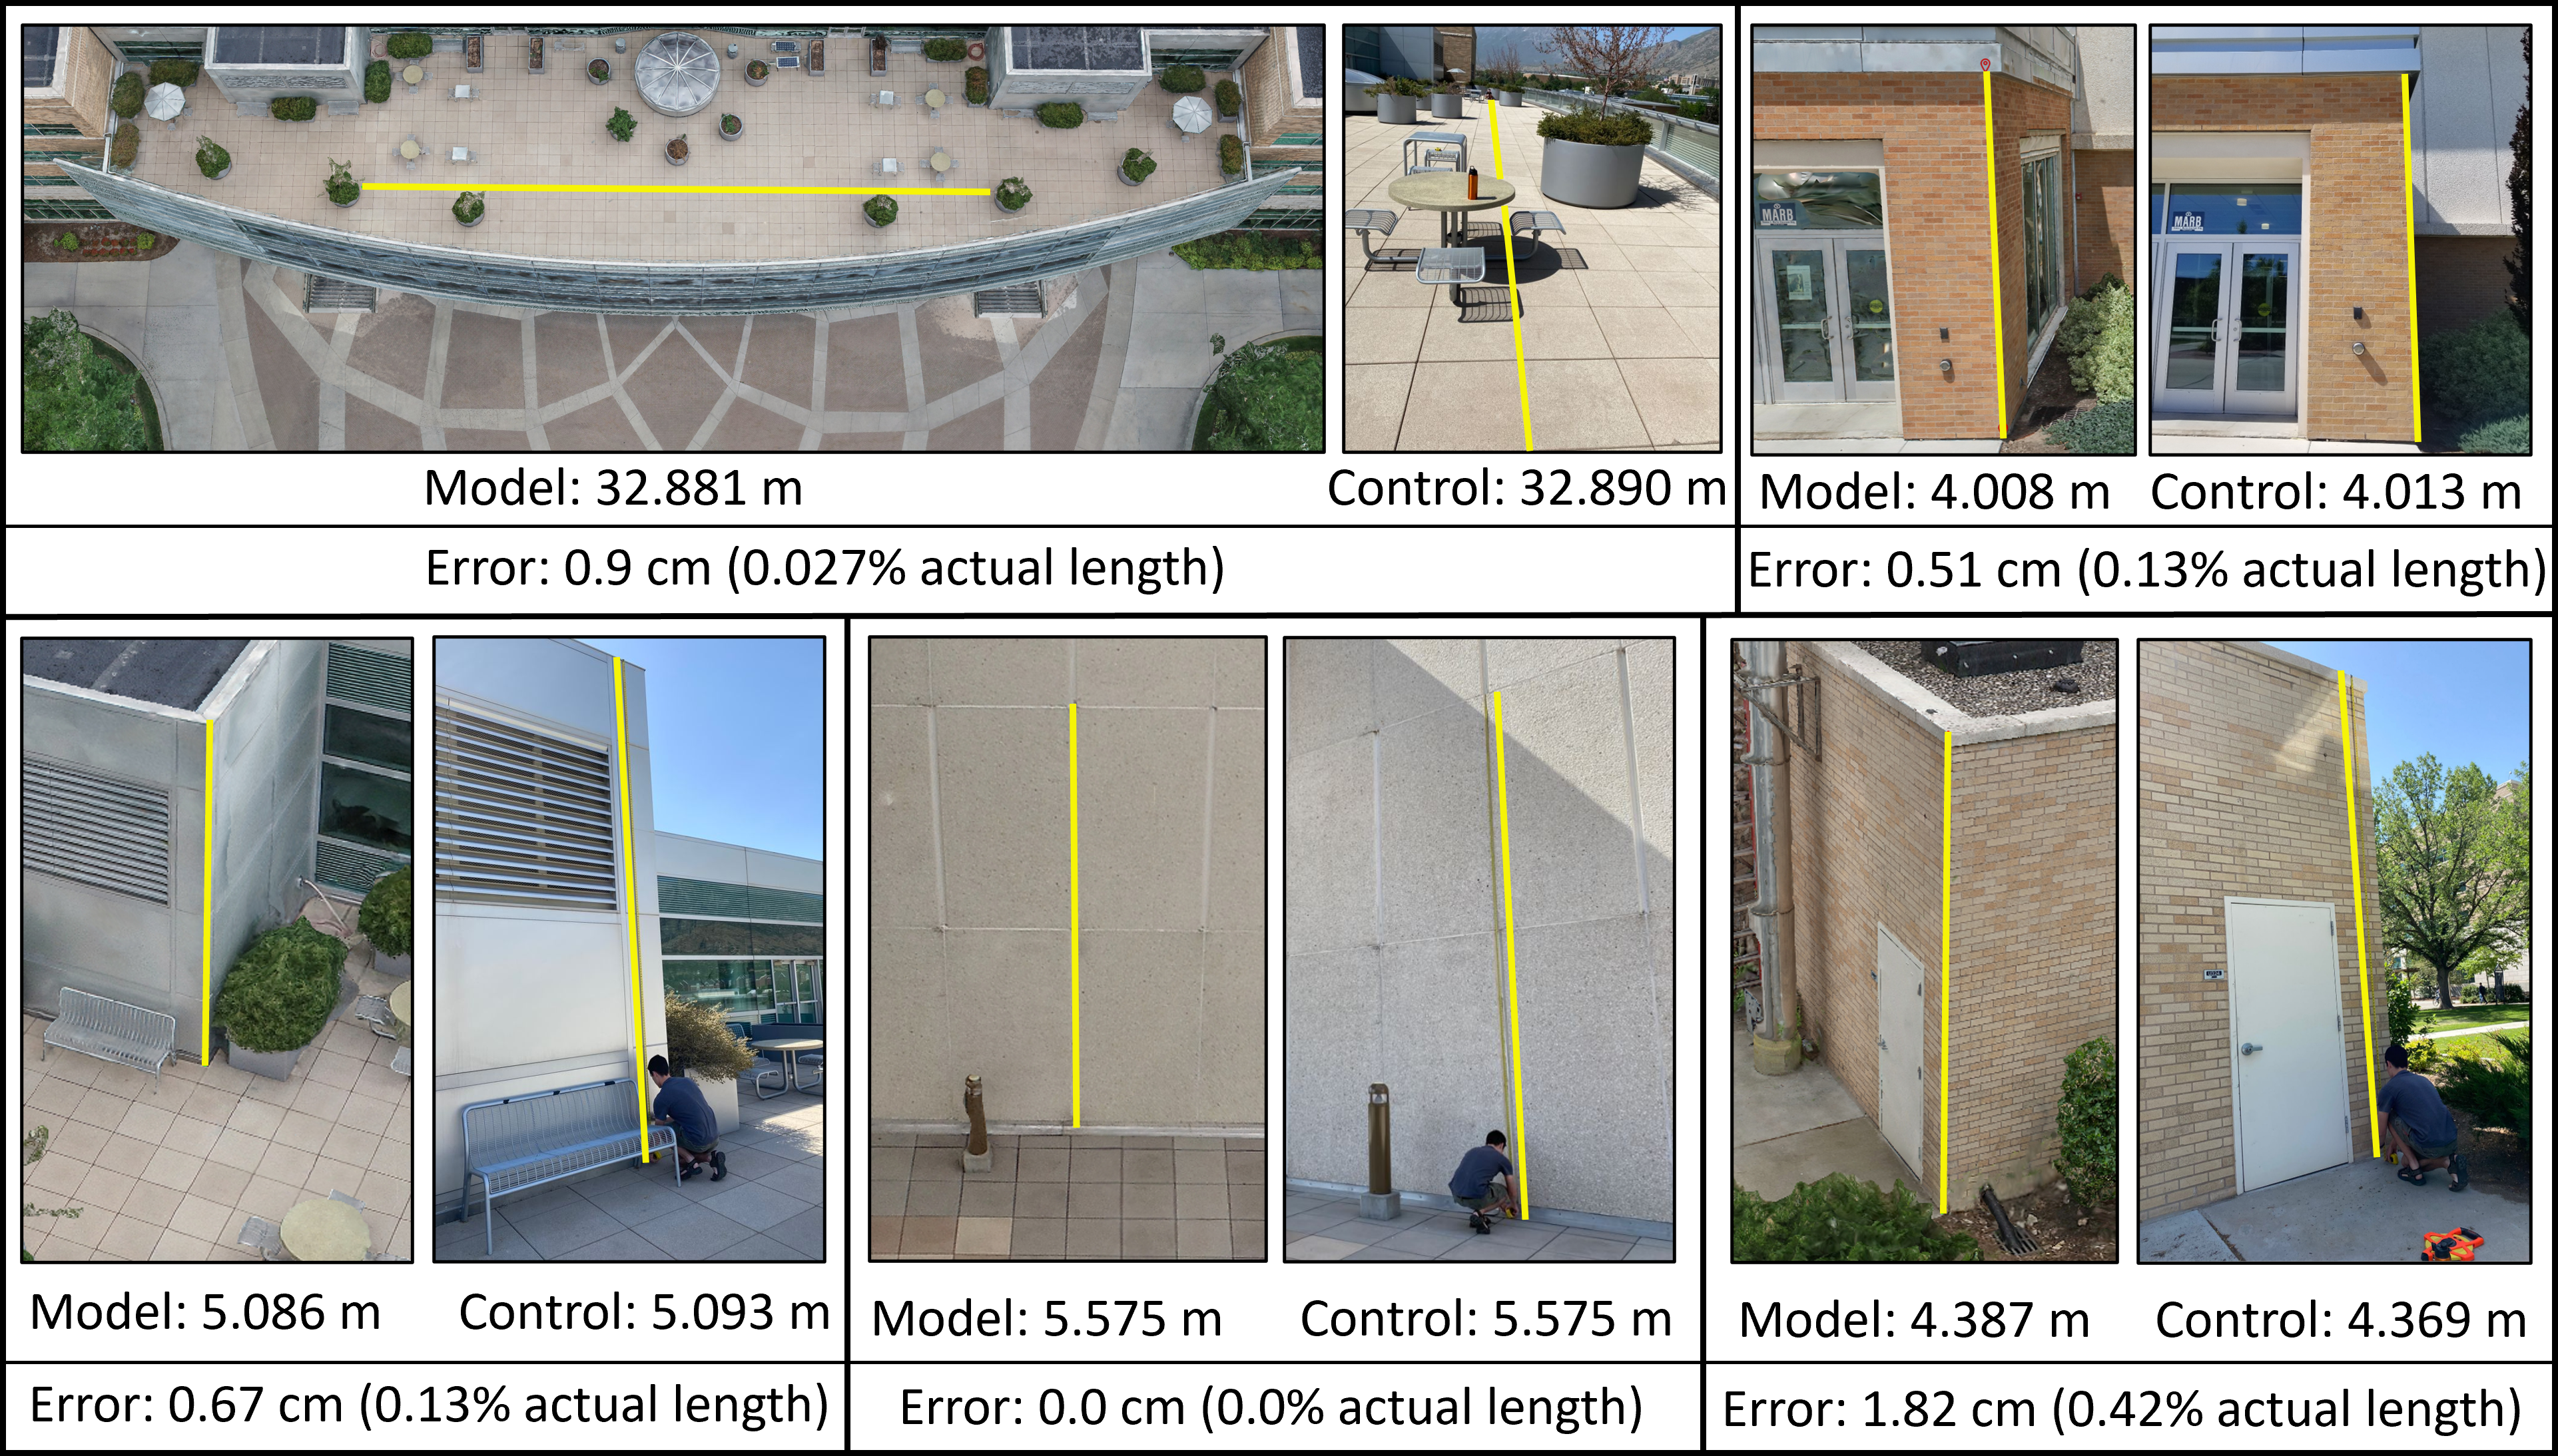
For more detailed information on accuracy, resolution, and other statistics, view our published article from MDPI Drones.
If you have a question or would like to use model data for your project/research, please contact us through this forum.